SilentShield 2.7 answers a question we hear often: why did this visitor get this verdict? Every entry under User Interactions now has a page that walks through the decision step by step. The evaluation itself does not change; the page shows how it came about. The full list is on the changelog.
What is new
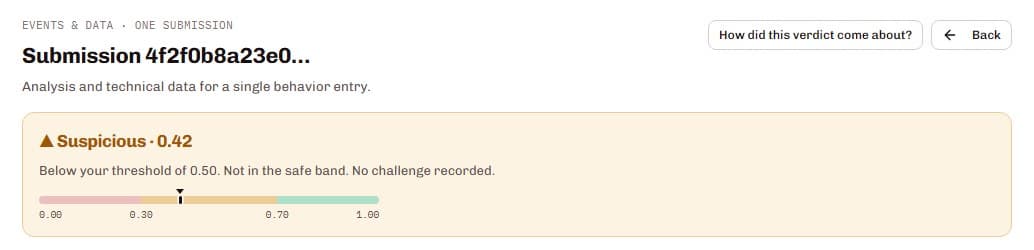
Open any entry under User Interactions in your dashboard. Next to the verdict there is a new button, “How did this verdict come about?”. It opens a page with seven steps on the left and the detail of the selected step on the right. Each step carries a status, so you see at a glance where something stands out.
What the seven steps show
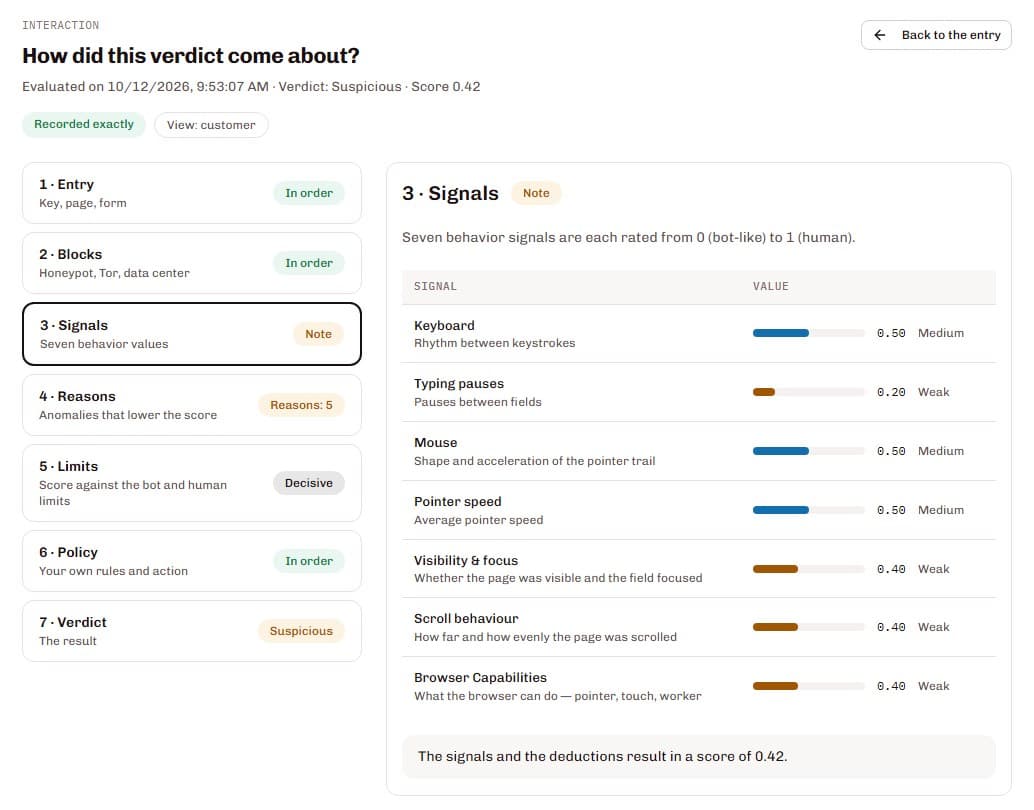
- Entry: the key, the page and the form the visitor used.
- Blocks: whether a honeypot was filled and whether the visitor came through Tor or a data center.
- Signals: the seven behavior values the widget measures, each rated from 0 (bot-like) to 1 (human) and shown as weak, medium or strong.
- Reasons: what lowered the score further, for example no typing pauses or a repeated fingerprint.
- Limits: where the score sits between the bot limit and the human limit, and whether the limit decided.
- Policy: whether one of your own rules moved the verdict.
- Verdict: the result.
If a rule decided before the score counted, such as a filled honeypot or a repeated fingerprint, the page names that stage. Numbers are written the way your language writes them: 0,40 in German, 0.40 in English.
What you do not see, and why
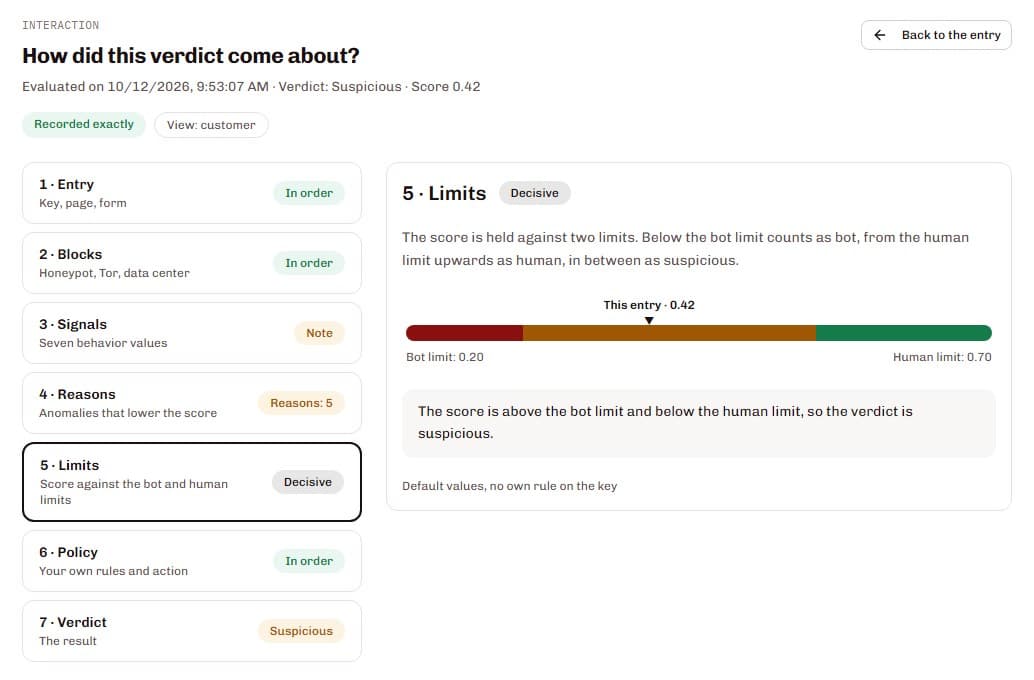
As a customer you see the strength of each signal, the reasons and the limits. The weights, the amount each reason took off and the raw sum stay with us. Accounts are free to create, so anyone can point the widget at their own key. A page that said exactly how much each behavior counts would double as a manual for getting past the check. The signals, reasons and limits are yours; the arithmetic is not.
Older entries and availability
Entries from before 12 October 2026 are only partly recorded: the signals and reasons are there, while the limits and policy steps say “not logged”. From that day on, every evaluation records how it came about, so newer entries are complete. The page is available in every account and every plan, and there is nothing to switch on.
Log in to your dashboard, open an entry under User Interactions and look for the button.